Financial Highlights
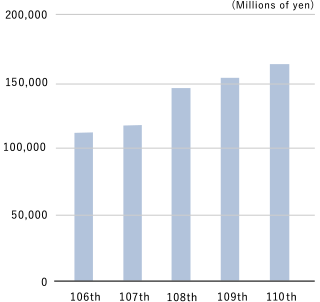
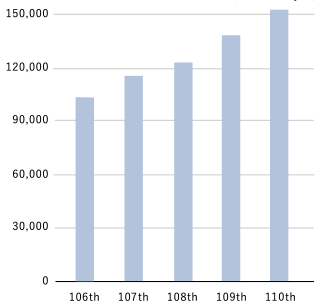
Net sales
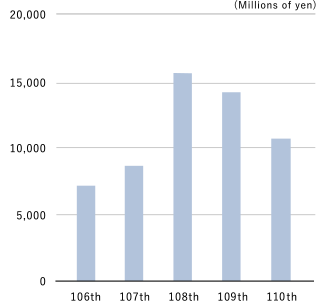
Operating profit
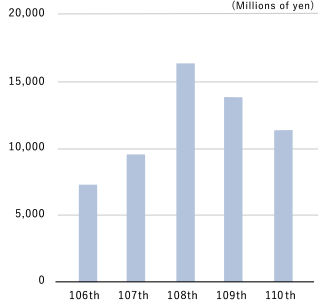
Ordinary profit
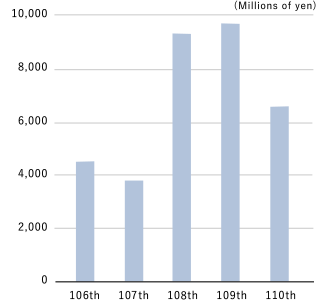
Profit attributable to owners of parent
Net assets
Total assets
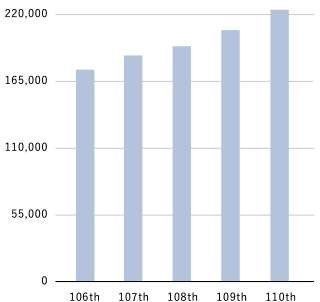
| Period |
108th |
109th |
110th |
111th |
112th |
| Fiscal year |
FY2022 |
FY2023 |
FY2024 |
FY2025 |
FY2026 |
| Net sales |
(millions of yen) |
149,082 |
164,020 |
166,884 |
196,766 |
209,717 |
| Operating profit |
(millions of yen) |
15,715 |
13,632 |
11,177 |
10,257 |
18,826 |
| Ordinary profit |
(millions of yen) |
16,605 |
13,204 |
12,056 |
11,437 |
20,221 |
| Profit attributable to owners of parent |
(millions of yen) |
9,279 |
9,780 |
6,602 |
9,019 |
14,033 |
| Net assets |
(millions of yen) |
126,371 |
139,410 |
150,722 |
151,971 |
167,622 |
| Total assets |
(millions of yen) |
197,732 |
208,335 |
229,577 |
240,179 |
310,412 |
| Net assets per share |
(yen) |
1,443.45 |
1,591.01 |
1,692.17 |
1,798.35 |
1,999.28 |
| Earnings per share |
(yen) |
111.55 |
117.58 |
79.38 |
109.35 |
178.37 |
| Capital ratio |
(%) |
60.7 |
63.5 |
61.3 |
58.9 |
50.7 |
| Rate of return on equity |
(%) |
8.0 |
7.7 |
4.8 |
6.4 |
9.4 |
| Price earnings ratio |
(times) |
6.35 |
6.09 |
12.46 |
12.04 |
13.92 |
| Net cash provided by operating activities |
(millions of yen) |
8,539 |
15,818 |
8,951 |
17,713 |
7,580 |
| Net cash used in investing activities |
(millions of yen) |
△7,256 |
△5,507 |
△6,326 |
△12,259 |
△32,834 |
| Net cash used in financing activities |
(millions of yen) |
△4,759 |
△4,920 |
△5,840 |
△6,477 |
31,726 |
| Cash and cash equivalents at end of period |
(millions of yen) |
32,949 |
39,729 |
37,056 |
37,789 |
43,236 |


